Beverage News
Consumers’ Preference For Bottled Water is Growing
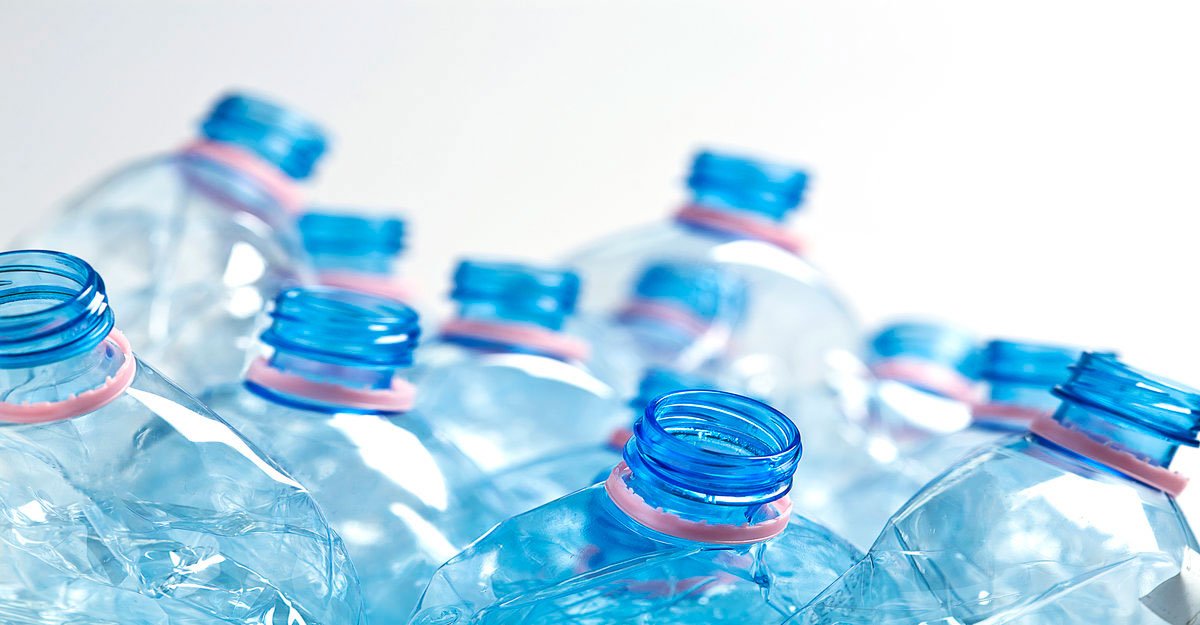 More than 7 in 10 Americans (72 percent) say bottled water (still and/or sparkling) is among their most preferred non-alcoholic beverages – an increase of 9 percent over last year, according to a new national survey. Bottled water is the most preferred beverage, followed by coffee at 61 percent and soft drinks (regular and/or diet) at 59 percent.
Nearly all Americans (93 percent) say bottled water should be available wherever other drinks are sold, with 89 percent saying they drink bottled water while they travel, 82 percent of employed Americans drink it at work, and 75 percent of all people drink it at home.
The survey, conducted online by The Harris Poll on behalf of the International Bottled Water Association (IBWA) of approximately 2,000 U.S. adults aged 18 and older, also found nearly all Americans (99 percent) drink water – tap, filtered, or bottled. Thirty-seven percent drink both bottled water and tap/filtered water equally. Another 37 percent drink only/mostly bottled water (up 7 percent from last year), which consists of 21 percent who drink mostly bottled water and 16 percent who only drink bottled water. Approximately a quarter of Americans drink only/mostly tap or filtered water (down 10 percent from last year), which consists of 16 percent who drink mostly-tap or filtered water, and 10 percent who drink only tap or filtered water.
When asked about their general opinion of bottled water as a beverage choice, 90 percent of Americans had a “very positive” or “somewhat positive” opinion of bottled water (up 4 percent from last year). Only 10 percent of Americans have a “somewhat” or “very” negative opinion of bottled water as a beverage choice (down 4 percent from last year).
“The results of this poll are consistent with recent consumption figures that show, for a third year in a row, bottled water is the No.1 packaged beverage in the United States,” says Jill Culora, IBWA’s vice president of communications.
“People are continuing to shift away from less healthy packaged drinks and are choosing the healthiest option – bottled water.”
The survey also found that among those who have ever purchased bottled water, people who identify bottled water as among their most preferred beverages are more likely than those who prefer soda to say that they always/often recycle their water containers at home (71 percent vs. 67 percent). This is consistent with a 2017 PET bale analysis study that found bottled water is the most recycled product in curbside recycling systems, with a rate of 53.9 percent, compared to soda bottles, which was 20.4 percent. The 2017 study, by the National Association of PET Container Resources, included other food and beverage containers in its analytics.
When asked who should be primarily responsible for recycling empty bottled water containers, 78 percent of Americans said consumers. Fifty-nine percent said companies (bottled water producers and retailers), 31 percent said government, and 21 percent said all of the above.
Bottled water drinkers find many factors important when choosing a beverage, but taste (98 percent), quality (98 percent), and safety (90 percent) are at the top of their list. Bottled water drinkers also say that features like ready to enjoy (81 percent), convenient packaging when on the go (81 percent), and re-sealable containers (75 percent) are important to them when choosing a beverage. Sixty-eight percent of bottled water drinkers say low calories are important when choosing a beverage, while 70 percent say the lack of artificial sweeteners is important.
Eighty-four percent of Americans say they should drink more water, and 91 percent believe that bottled water is a healthy and convenient beverage.
IBWA encourages consumers to make healthy hydration a part of their daily lives and pick bottled water as their beverage of choice, whether it’s at home, at the office, or on the go.
Source: Bottled Water

